|
The Sedibeng District Municipality is located in the southern parts of the Gauteng Province, and features the cities of Vanderbijlpark, Vereeniging and Evaton. Accounting for approximately 33% of the national GDP, the Sedibeng District Municipality is perceived as an integral part of the Gauteng Province. The District Municipality features more than a wide variety of landmarks, such as the Vaal River and Vaal Dam, the Suikerbosrand Nature Reserve, the Sasol refinery, the ArcelorMittal (previously ISCOR) factory, as well as the Emerald Casino and Safari Park.
In this section an overview is provided on available information that helps us to analyse, interpret and understand the Sedibeng region. This chapter talks to the current reality while the next chapters begin to address our desired future.
4.1
A place steeped in history
Flying over the Sedibeng landscape, reveals the stone circles marking settlements of people that lived in the region from the dawn of time. The area has moved on from its pre-historic roots to play a crucial part in shaping the South Africa we live in. While the landscape has been shaped by the Vaal River, our communities have been carved out of struggles for freedom. The long and bloody history of South Africa's journey through the Boer War, and the long years of apartheid, can all find their story right here in the heart of Sedibeng
The Treaty of Vereeniging (commonly referred to as Peace of Vereeniging) was the peace treaty, signed on 31 May 1902, that ended the South African War between the South African Republic and the Republic of the Orange Free State, on the one side, and the British Empire on the other.This settlement provided for the end of hostilities and eventual self-government to the Transvaal (South African Republic) and the Orange Free State as colonies of the British Empire. The Boer republics agreed to come under the sovereignty of the British Crown and the British government agreed on various details.
None of this meant a great deal during the long, dark, oppressive years of apartheid that were to follow, and the brutal and violent fight to break down a tyranny of oppression and inhumanity. The world will never forget what is now marked as our day of Human Rights in South Africa. On 21 March 1960, events were planned for many parts of the country, for people to protest against one of the unjust laws of apartheid. The Pass Law required all Africans living or working in and around towns to carry documents (known as passes) with them at all times. Failure to carry this document would lead to arrest by the police.
On this day people decided to go to police stations without their passes and to demand that they be arrested. The idea was that many people would be arrested and the jails would become so full that the country's unjust laws would be exposed to the international world. It was hoped that this would lead to the draconian laws being scrapped. At Sharpeville in Sedibeng, thousands of unarmed people gathered at the police station demanding to be arrested. They were met by 300 police officers who opened fire on the crowd. Sixty-nine people were killed and more than 180 others were injured in the Sharpeville Massacre. This event precipitated the banning of the ANC, and the PAC and the start of the armed struggle. Every year on the 21st March, the people of Sedibeng, the country, and the entire world bow their heads to observe the brutal killings of anti-pass laws and apartheid protestors - making it one of the most historic political events which shook the world and changed the course of history in South Africa.
And so began decades of further oppression and restrictions of freedom that ultimately culminated in the dawning of democracy in 1994. But Sedibeng was to see some much darker days before that beacon of light came into sight. The early 1990s in South Africa, the period when negotiations were unfolding between the ruling National Party and the ANC, is marked as one of the most violent and turbulent times in our history to democracy. And Sedibeng saw some of the worst of it.
On 12 January, 1991, 39 mourners were viciously murdered at an all-night vigil, and over forty were injured. At the Nangalembe Night Vigil Massacre in Sebokeng. Mourners were paying their final respects to their community leader, when a sudden invasion by a gang of armed men resulted in a hand grenade being set off and the aggressors began to shoot randomly into the crowd. The Nangalembe Night Vigil Massacre will go a long way into the books of our history as it heralded an undefined and unresolved period of brutal attacks against the Sebokeng community.
Just over a year later, Sedibeng was to mourn again. On the night of 17 June 1992, a heavily-armed force of Inkatha members, secretly raided the Vaal township of Boipatong and killed 46 people. The Boipatong Massacre caused the African National Congress to walk out of CODESA, the initial formal negotiations to end apartheid, accusing the ruling National Party of complicity in the attacks. The massacre drew the attention of the United Nations Security Council, which passed Resolution 765 on July 16, 1992, urging a full investigation into the incident.
Sedibeng cannot bring back its fallen heroes, but it can celebrate them through its continued struggles to end poverty and bring about economic equality. From 1902, the region seemed to almost have come full circle, and appears to be a most fitting place for the Signing of South Africa's First Democratic Constitution in 1996. The 10th December 2011 marked the 15th Anniversary of the signing of the South African Constitution into law - by the then President of South Africa, Mr. Nelson Mandela, in Sharpeville.
The year 2012 has turned out to be a remarkable and amazing year in the history of South Africa and Sedibeng. This year the ruling party celebrates its centenary, 100th year of a selfless struggle to liberate South Africa and the African continent, making it a historic moment for all the people of South Africa.
4.2
An integral part of the Global City Region (GCR) of Gauteng
Sedibeng encompasses the southern part of the Gauteng Province. Together with the key cities of Johannesburg, Tshwane and Ekurhuleni, Sedibeng forms an integral part of the largest urban economy in sub-Saharan Africa and Gauteng accounts for 34% of National GDP.According to the OECD report of 2011 Gauteng is also one of the fastest growing city regions in South Africa.
The importance of this region in the South African spatial economy is increasingly realised through the collaborative Global City initiative within Gauteng. The GCR is an initiative recognising the international impact of the Gauteng urban complex. The promotion of a GCR is characterised by the transformation of urban Gauteng as a loosely defined network of urban centres to a cohesive and aligned urban system that is characterised by economic integration and global competitiveness.
Over the last few years the idea has gained momentum and we are moving with purpose towards developing Gauteng as a competitive GCR. The OECD Territorial Report of 2011 benchmarks Gauteng against competing economies around the world and identifies those areas that need to be developed in order to be a formidable competitor. This requires several areas to be developed including:
- Government policies,
- Strategic interventions in investment priorities,
- Rolling out the necessary infrastructure,
- Ensuring that the people of Gauteng have the necessary skills to be competitive,
- Marketing and branding Gauteng appropriately
- Ensuring that Gauteng has a smart economy that will deliver the leading edge
In the near future Gauteng will become a province made up exclusively of Metropolitan or Single Authority municipalities. GDS 2 takes due consideration of the need to move to a Single Regional Authority as one of its flagship projects. 4.3
Population Dynamics
4.3.1 The Population of Sedibeng
The Sedibeng District Municipality constitutes the second largest municipality in the province geographically, covering a land area of about 3,894 km2. Figure 2 below outlines the population distribution of Sedibeng as outlined in the Statistic South Africa Community Survey of 2007.

According the Gauteng Province Socio-Economic Review of 2009, Sedibeng has a population of 805,000 (8%), the fourth largest in the province, and covers the second smallest population density of 192 people per km2 .The National Planning Commission (NPC) estimates that by 2030, about 70 percent of people are likely to be living in urban areas. Gauteng and the cities of eThekwini and Cape Town are the fastest growing city-regions, with implications for planning and delivery of basic services. Sedibeng will have to factor this into its long-term planning.
The NPC also makes some very critical points in respect of population dynamics. It points out our country's population growth is slowing. The NPC report states that if the current fertility rates continue to decline and the economy continues to expand at the current rate, the population of South Africa will grow from 50.6 million to 58.5 million by 2030. If the economy contracts and the fertility rate remains the same this figure could rise to 60 million.
4.3.2 Population profile
a | Population by Race
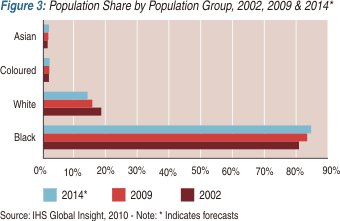
Figure 3 shows the population share by population group in 2002, 2009 and the estimation for 2014. The black population represents the largest population group (over 80% in 2009) and the forecast is that it will continue to do so into the future. Whites are the second largest population group (around 18%) followed by Coloureds and Asians. The white population group is expected to decrease by 2014.
b | Population by Age and Gender
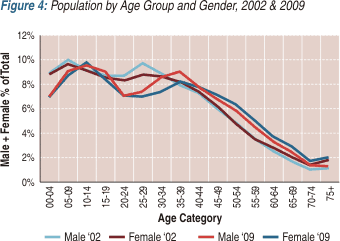
Figure 4 above shows the population group by gender and age for the two years 2002 and 2009. The main point from these figures is that there appears to be an equalizing of gender numbers in most categories and age groups over the 7 years from 2002 to 2009. For example in 2002, there were more males than females in the age groups from 00 to 04 and from 05 to 09 years and 25 to 29.
The NPC report points out that currently, South Africa has reached what it calls the 'sweet spot' of transition. This is where the number of working age people is proportionally high and the number of young and old is proportionally low. This provides a critical opportunity to use the work force size, get people working and build a strong and robust economy and social system by 2030. This will be very necessary as the opportune age profile will have changed by 2030, with a lot more older people becoming dependent on the state and economy. GDS 2 cannot ignore the age of its population and the importance of the working population active now, so that in 2030 we have a strong enough economy to support an ageing population.
c | Mortality
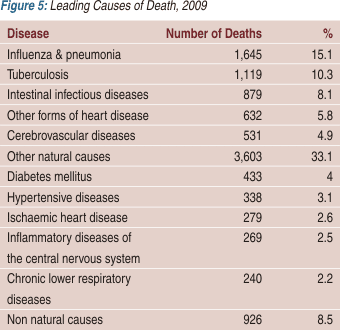
Figure 5 sets out the number of deaths that occurred in Sedibeng in 2009 as a result of diseases. Statistics South Africa (Stats SA) reports that the total deaths recorded in the Sedibeng municipality equalled 10,894. The leading cause of death was influenza & pneumonia, followed by tuberculosis. These two illnesses together claimed the lives of 2,764 people in the metro. It is important to note that the two illnesses are also HIV/AIDS opportunistic diseases and most of the deaths could have resulted from HIV+ people.
4.4
Poverty
Understanding poverty within Sedibeng requires knowledge of the various factors that trap individuals, households and communities into a confinement of poverty.Only a multi-disciplinary approach to eradicating poverty will work. Issues of health, education, human development, food security, access to services, access to income and safety and security, will all have to be understood and tackled under the broad GDS2 umbrella if poverty is to be meaningfully reduced. Where information is lacking, data will have to be gathered.
4.4.1 Poverty and Health
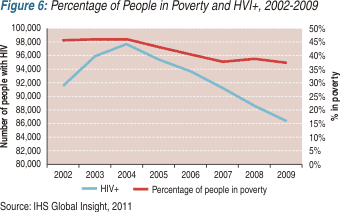
Multifarious studies indicate the inextricability of health issues from poverty issues The Gauteng Socio Economic Review, speaks to the relationship between the percentage of people in poverty and those that are HIV+. The figure below shows that though there may be some link, it is not the only link, and further relationships to poverty, like unemployment, education and access to social packages also have to be explored.
Figure 6 shows that although we see a positive decline in the percentage of people who are HIV+ from 2004 in Sedibeng, the percentage of people living in poverty, though also declining, did so at a much slower rate in 2009. This is indicative of other factors having an impact on poverty.
4.4.2 Poverty and Unemployment
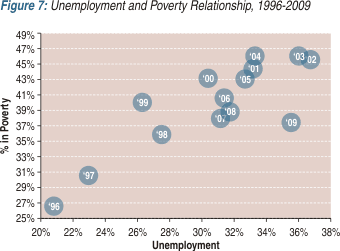
The inability to earn or generate income is an obvious factor exacerbating poverty levels in South Africa, Gauteng and Sedibeng.The Gauteng Province Socio Economic Review cites that the unemployment rate in Sedibeng increased from 20% to 36.7% from 1996 to 2002. At the same time the rate of poverty was measured to increase from 26.6% to 45.7%. In 2009 there was a correlation between decreasing unemployment and poverty rates. Figure 7 below illustrates this obvious and critical link between unemployment and poverty.
The OECD Territorial Review estimates that only 15% of South Africa's GDP changes hands in the informal economy. This stands in stark contrast to other emerging markets that are also characterized by a majority living in poverty and unemployment (for example India and Brazil) where the proportion is 50%. Stimulating South Africa's sluggish informal sector must form a critical part of a poverty eradication strategy and could go a long way in abetting the youth unemployment problem as well as general unemployment.
4.4.3 Poverty, Inequality and Human Development
The Gini coefficient of inequalityis the most commonly used measure of inequality. The coefficient varies between 0, which reflects complete equality and 1, which indicates complete inequality i.e. one person has all the income or consumption, all others have none. The OECD states a South Africa Gini coefficient of 0.70, higher than the OECD highest country (Mexico) which has a 2004 figure of 0.47.The concentration of wealth in the hands of so few and the spread of poverty across so many is neither sustainable, nor conducive to a healthy, prosperous, and democratic society, in which all citizens benefit.
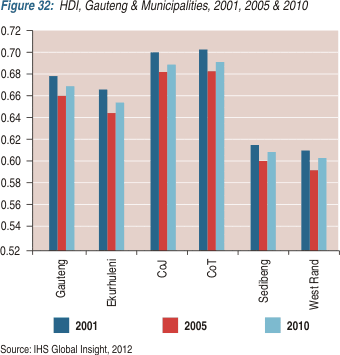
The Human Development Index (HDI) is a composite statistic used to rank countries by level of human development. The HDI is a comparative measure of life expectancy, literacy, education and standards of living for countries worldwide.
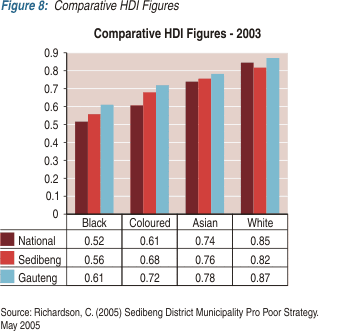
The Gauteng Province Socio Economic Review notes that in terms of HDI Sedibeng is performing worse than the Gauteng average. This indicates a low level of development in Sedibeng. Income inequality has increased from 0.577 in 1996 to 0.652 in 2002, where it has remained fairly stagnant to 2009. HDI has worsened between the years 2002 to 2009, decreasing by 1.28 percentage points.
4.4.4 Poverty and Literacy
The NPC diagnostic places high on the agenda the need for better education, including literacy for a future South Africa. Partnerships, with institutions of learning in Sedibeng, are a key focus of GDS2.

4.4.5 Poverty and Multiple deprivation
The Human Sciences Research Council (HSRC)& Oxford University conducted a study on multiple deprivation in Gauteng in 2006. Thestudy revealed that the areas of highest multiple deprivation within Sedibeng are concentrated within the Emfuleni townships, also the areas of highest population concentration. In addition, rural areas show high levels of deprivation, illustrating the need to also pay attention to the communities in these areas.
4.5
Service Delivery
Service delivery in Sedibeng over the medium and long term has been mixed – with some significant successes and some important areas that continue to require focused attention. There have been steady improvements over the last 15 years with respect to: access to basic services, health and HIV AIDS services and elements of public safety. Although delivery has taken place, the challenge of housing and road delivery and improvement remain important, and are critical to the success of the overall GDS 2. Environmental management that focuses on water pollution, waste management and air quality control, also remain key issues.
Although many of the service delivery issues reported upon here are not of a strategic nature, and many of them are the direct responsibility of the municipality, they do form some of the necessary ingredients to allow a long-term growth and development strategy to be successful. In that context they are worthy of mention.
4.5.1 Access to Basic Services
a | Water
95.5% of households have access to piped water, 92% of which, either have it in their dwelling place, yard or a communal area within less than 200m of their house. There are still around 5000 households of an estimated 252 876 households who do not have access to clean piped water. Extending and maintaining the level of piped water to all residents remains critical. 6kl free water must be rolled out everywhere.
b | Sanitation
91.2% of households have access to some form of sanitation, with the majority having flush toilets, followed by pit and VIP toilets.Access to sanitation has steadily increased over the last 15 years from 79.2% of households in 1996. The bucket system has still not been fully eradicated and there are still households that have no access to sanitation.
The Regional Sewer Scheme has not been delivered and the regional water demand and management system programme has not been achieved. Bulk Sewer capacity remains a challenge as does the extension of the highest quality of sanitation services to all households
c | Electricity
88.7% of households have access to electricity. Most users use electricity for lighting and other purposes. Free Basic Electricity is provided to indigent @ 50 KWh. However, with respect to provision, a backlog of 11.3% still exists, and needs to be eradicated. Cable theft remains a challenge as does the reading of metres. Given the various climate and environmental challenges facing the world, South Africa, Gauteng and Sedibeng, innovation around alternative sources of energy must become a critical priority for the region.
d | Waste Removal
95.6% of households have access to refuse removal. Prior to 2009 it was 64%, but very successful extension of this service brought the figure up in 2009. Payment levels for the service need to be improved.
e | Environmental Management
The Environmental Programme of Action (EPoA) was launched in 2007 to give concrete expression to GDS1. Focus areas of this programme are: water pollution, air quality; and waste management. Inspections have been done in some big companies around air quality improvement and management and some of these have developed mechanisms to reduce air pollution. There has also been staffing up of environmental officers. Although a framework is in place, by-laws were not promulgated so enforcement has been generally weak. Sedibeng will have to continue to highlight and prioritize the long-term environmental sustainability factors, growth of the green economy and promote low carbon footprint throughout the region.
4.5.2 Waste Management
Delivery in this area needs attention from the municipalities. An integrated waste management plan is still needed. Safe disposal of medical waste remains a challenge. Control of industrial waste to decrease environmental (air, land and water) pollution is not adequate and landfill sites have not been created.
4.5.3 Health and HIV AIDS
The Sedibeng District has 3 district hospitals, 32 clinics, 10 mobiles, 1 satellite and 4 community health centres. There has been successful delivery of the national immunization campaign and TB immunization, and H1N1 vaccinations over the past 5 years. Approximately 86 481 people are estimated to have been living with HIV in 2010 with about 7495 deaths that year. The HIV prevalence rate decreased from 31.8% in 2008 to 28.9% in 2009. Some of this could be attributed to the successfully implemented HIV / AIDS Council in place in SDM and locals. Uncertainty on health institutionalisation (provincialisation) continues to remain a challenge and could be part of some of the delays in delivery of health programmes.
4.5.4 Housing
83.9% of the citizens of Sedibeng have access to formal housing, and 16.1% have access to informal housing. Sedibeng has delivered more houses per capita than most other places in the country. However, reducing the housing backlog through mixed income, mixed tenure and mixed land use developments on well-located land has not been delivered as effectively as planned. Houses have been built in the absence of a comprehensive human settlement plan. This has led to enormous challenges in meeting subsequent community needs. There has been too much focus on urban housing and rural housing has been neglected.
4.5.5 Public Safety
Any crime is bad for business, and Sedibeng reports that crime has showed a steady decline. The challenge is to make sure that crime does not become a barrier for investment in the area. Municipality reports indicate a reduction of crime, generally in Sedibeng. This could be attributed to the implementation of CCTV and CPF patrollers in communities. Traffic safety improvement, targeted through establishment of municipal courts has also had a positive impact on road safety.
4.5.6 Roads
Road networks are a critical component of strategic economic infrastructure to enable the economy of a region to prosper and thrive. It is the view of the Sedibeng District and its municipalities, that delivery of new roads and adequate maintenance of existing roads has not been satisfactory. Some delivery has occurred. For example the Lesedi Local Municipality constructed 50km of roads @ 10Km per year in the past five years, but generally there is a backlog in the construction of roads which has to be addressed.
4.5.7 Community Facilities and Social Development
The distribution of community facilities and public amenities is very uneven across the Sedibeng region. Many communities are in dire need of community facilities and there are concentrations of areas with no facilities at all. Social development programmes such as ECD, Victim Support Programmes, Sports Councils, Youth Development Centres, and the Bana Pele programmes have been rolled out, but need intensification under the GDS2 umbrella.
4.5.8 Customer Relations Management
According to the municipalities, although in some areas, pockets of excellence exist, there is great scope for improvement in all areas of client services. This includes but is not limited to improving on:
· Reducing turnaround times for planning approvals
· Reducing turnaround times for fixing pot holes
· Improving Emergency Management Service response times
· Improving on ensuring accurate electricity and water bills
4.5.9 Conclusion
Creating or maintaining a quality level of services across the board from basic needs and infrastructure, to a safe society that provides solid facilities and programmes to its communities, is the necessary platform required for the successful long term implementation of a Growth and Development Strategy for the region. Getting the basics right is as important as cutting into new frontiers. The Sedibeng District commits to focusing on the main service delivery challenges that could impede the successful realization of GDS 2.
4.6
The Economy
4.6.1 The Context
Poverty eradication depends on sustained long-term, inclusive economic growth.This growth must generate decent work and other income generating opportunities for the people of Sedibeng.
4.6.2 Current Size
Interpretation of economic status requires a sound understanding of the size of the economy and its dynamics in the past. A number of indicators exist that can describe the economy of a region or an area. The most common variables that are used for the analysis include production, and Gross Domestic Product per Region (GDP-R)
.
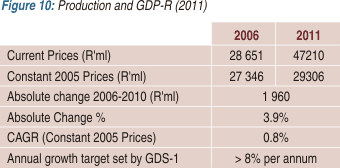
Figure 10 below provides an indication of the current production and GDP-R values in the study areas, measured as Gross Value Added (GVA). It shows that Sedibeng's economy grew by 3.9% from 2006 to 2011, with a growth of R 1 960 million in this period. A calculated Compounded Annual Growth Rate (CAGR) of 0.8% over this period from 2006 - 2010 is also indicated, accounting for a tenth of the desired annual growth target as set out by GDS-1 in 2006. This annual growth rate target of 8% for Sedibeng, is very high when compared to the annual growth rate target of South Africa, which is set at 5.4%.
4.6.3 Economic Trends
The GDP-R historic trends of the Sedibeng District Municipality compared to the GDP-R historic trends of South Africa are shown in Figure 11 below. It indicates that the growth of Sedibeng has been steady between 2006 and 2007, and then declined sharply before increasing again in 2010, where it has been growing steadily again in 2011. In 2009, the sharp drop in the economic growth can be ascribed to the global economic crunch, affecting the global economy as exports declined. The economic growth for Sedibeng is estimated to be higher than the economic growth for South Africa (3.8%, StatsSA).

Fluctuations in the global and regional economies, as well as the spin-off impacts of these trends experienced in the country, also affected the growth visions of provincial and local municipality's economies. It appears though, that Sedibeng's economy was less resilient to the changes in the European markets in 2003 and the crises of 2008 than the national economy.
4.6.4 Sectoral structure of the Sedibeng Economy
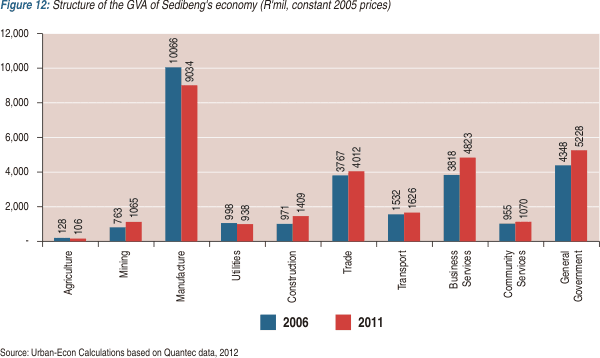
Figure 12 presents the sectoral structure of the GVA of the Sedibeng District Municipality's economy. Key driving sectors of Sedibeng are the Manufacturing, General Government, Business Services and Trade sectors. Of these, only the Manufacturing sector forms part of the Secondary sector, where the others all form part of the Tertiary sector. It can also be seen that all of the sectors presented below has seen an increase in GVA, except Agriculture, Manufacturing and Utilities. Of these, Manufacturing has seen the biggest decrease with -6%, and Business services have seen the biggest increase in this period with 2.5%.
4.6.5 Imports and Exports
Figure 13 highlights the biggest contributors to the International Trade market, or exports. For Sedibeng's economy, the biggest export contributors was Base metals, contributing 74.1% to the total amount of exports in 2010, 28.6% more than it did in 2006. Other exports are made up of Machinery and mechanical appliances; Stones and precious metals; Transport equipment and Mineral products.

Of all these export products listed above, Mineral products has seen the biggest decline in the period from 2006 to 2010, with a decrease of R 7,6 billion (-44.6%). This can be ascribed to the global economic impacts as described in Section 2.2. The biggest export countries are some European countries and the United States.
4.6.6 Employment
Employment is the primary means by which individuals who are of working age may earn an income that will enable them to provide for their basic needs. As such, employment and unemployment rates are important indicators of socio-economic well-being. The following paragraphs examine the study area's labour market from a number of angles, including the employment rate and sectoral employment patterns.
The composition of the labour force in the Sedibeng District Municipality is detailed in Table 1-5. It describes the labour force from the official definition perspective, where the unemployed people are who:
did not work during the seven days prior the interview
want to work and are available to start work within a week of the interview, and
have taken active steps to look for work or to start some form of self-employment in the four weeks prior to the interview.
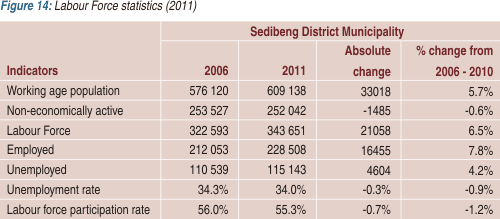
Figure 14 below indicates the labour force statistics for the Sedibeng District Municipality, where it can be seen that the working age population has increased by 5.7% since 2006, with a number of just over 600,000 people in 2011. The labour force itself has also increased with 6.5%, and can be linked to the population growth and the employment opportunities surrounding the FIFA World Cup in 2010. Both the unemployment rate and the labour force participation rate are down by -0.3% and -0.7% respectively. The lower labour force participation rate, however, means that a considerably higher percentage of people in the Sedibeng District Municipality were not looking for jobs and were not participating in economic activities. If the percentage of these non-economically active people, who were discouraged job seekers, were encompassed in the labour force, the unemployment statistics would have been worse.
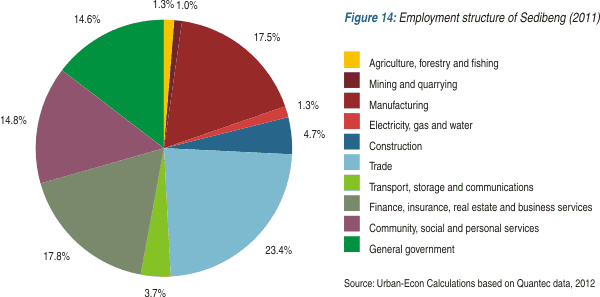
The following figure illustrates the employment structure of the Sedibeng District Municipality by sector. The largest number of people are employed by the Trade sector, followed by the Financial services and Manufacturing. The smallest employment sector is the Primary sector, contributing a total of 2.3% to total employment.
4.6.7 Salient Features
Although Sedibeng's economy has not met its annual growth target of 8%, it has still grown at a positive rate over the past five years, with the only negative growth rate recorded in 2009. The fact that it has continued to grow at a positive rate is indicative of a relatively strong economy, characterised by prominent GVA contributors that will be discussed in the next section.
Sedibeng's economy is also characterised by its strong exports, in particular the Base Metals and Machinery and mechanical appliances sectors, which contributes 16% and 3.7% to the Gauteng provincial economy's exports of these products respectively.
Even if the unemployment rate of Sedibeng's economy is still higher than that of South Africa (25% in 2011), it can be seen that the employment has improved over the period in analysis, with a decrease in 0.3% in the unemployment rate of Sedibeng, which accounts for more than 4,500 people in the region of the municipality who have found jobs.
4.6.8 Key Drivers in the Sedibeng Economy
This section considers the current drivers behind the Sedibeng District Municipality's economic base, as well as the initiatives that have been undertaken to expand some of these drivers. Although the agriculture sector is not a driver, it forms a vital part in the value-adding chain, and holds great potential for future development.
The manufacturing and trade sectors form the backbone of Sedibeng's economy, providing income and employment for more than 40% of the municipality's labour force. While taking a closer look, it is of equal importance to not lose sight of the sustainability aspects of the growth and development of this economy.
a | Manufacturing
The Sedibeng District Municipality is one of the five most important centres of high value mass production manufacturing in South Africa. Manufacturing contributed 30.8% to the local economy in 2011, making it the single biggest contributor to the municipality's GVA. This, in turn, is dominated by the fabricated metal (ArcelorMittal) and chemical (SASOL) sectors.
The absolute changes in the Manufacturing sector in the period from 2006 – 2011 is indicated in Figure !5 below. Although the metals, metal products, machinery and equipment subsector is the biggest contributor to the Manufacturing sector, it has also seen the biggest decrease in GVA in this period, at about -10.7%. The other main contributors are the Petroleum products, chemicals, rubber and plastic sector and the food, beverages and tobacco sector.

b | Tourism
For this section of the analysis, the subsectors catering and accommodation services have been used to indicate the growth rate of the Sedibeng District Economy's Tourism, as tourism in itself is spread over all other industries and sectors. As indicated in the IPAP-2 document, tourism is a vital driver of both local consumer spending and foreign exchange incomes, reinforced by a sustainable resource base, labour intensive activities and relatively low barriers to entry for entrepreneurs.
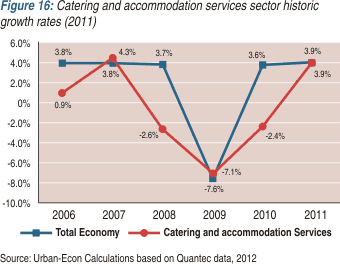
Figure 16 below presents the catering and accommodation services subsector in terms of the historic growth between 2006 and 2010, and compares it to the total economy of Sedibeng. The shape of the catering and accommodation services subsector curve of Sedibeng and that of the municipality's total economy has more or less the same shape, indicating similar growth during certain periods in time. Sedibeng's catering and accommodation services subsector, however, did not decline as sharply (-4.5%) as that of its total economy (-11.3%) in 2008, and also grew at a slightly lower rate than the catering and accommodation subsector of its total economy in 2010.
The Sedibeng District Municipality boasts an identified 202 different tourism-related sites and products, including a diverse range of tourism attractions and sites, providing for adventure, heritage, art, nature, sport, business and educational tourism. Some examples include the Vaal River, Vaal Dam and Suikerbosrand Nature Reserve.
c | Trade
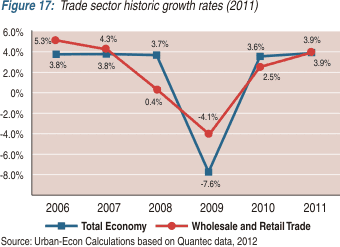
The trade section encompasses wholesale and retail trade, and forms part of the Tertiary sector. Figure 17 below shows the historical growth rate for Sedibeng's Trade sector compared to the municipality's total economy. Again, the shapes of the curves are very much alike, emphasising a similar sensitivity to the impact on the Sedibeng's economy during certain periods in time. The Trade sector, however, seems to have been a bit more resilient to the exogenous impacts of the global economic crisis in 2009, by showing a growth rate of -4.1% compared to the -7.6% growth rate of the total economy. The Trade sector also indicated a more gradual decline in its growth rate in the period from 2007 – 2009.
d | Agriculture
The Agriculture sector encompasses agricultural activities as well as forestry and fishing, and forms part of the Primary sector. In 2011, the Agriculture sector contributed a mere 0.4% to Sedibeng's GVA, with a total contribution of R 106 million.
In Figure 17 below, it is evident that the agriculture sector grew at a far lower rate than that of the total economy in 2006, with a growth rate of -17.7%. In 2007, the agriculture sector was still growing at a negative rate of -5.7%, but it has increased from the previous year. In 2009, the growth rate for the agriculture sector declined sharply again, but it has seen a steady increase after that to an estimated growth rate of 3.9% in 2011. In comparison, the growth rate of the total economy was higher in 2006 and in 2007 than that of the agriculture sector, but the shape of the total economy's curve was very similar to that of the agriculture sector in the period from 2008 to 2011.
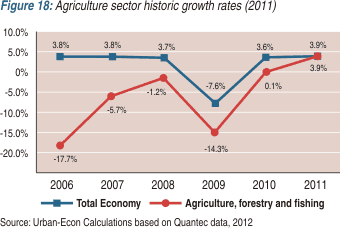
The reasons for the extreme fluctuations in the agriculture sector of the Sedibeng could be ascribed to the fact that the sector's average contribution to the total economy of the Sedibeng is 0.8%. This means that any small change in the economy will reflect as a large change in the growth rate, and because of the relatively small size of the agriculture sector of the Sedibeng, any impact on the municipality's economy will reflect as an enormous impact on the agricultural sector's growth rate.
The Maize Triangle Scheme was launched in 2010, and could be the reason behind the positive growth rate for that year. This scheme aims to provide support for farmers, and to build capacity amongst them, while at the same time assisting them in order to become more self-sufficient and to ensure food security. This scheme might also have had a positive reaction to the issue of job creation.
e | Growth Sustainability
The term “sustainable growth” refers to a growth rate that can be achieved without substantial or lasting harm to the environment and the economy's natural productive ability. It is evident from the preceding section that the Sedibeng does have enough underlying forces and drivers to be able to sustain relative growth performance over the long run, given that the economy should continue to be stimulated by new initiatives and renewal of current initiatives.
4.6.9 Constraints to Growth
Current growth constraints and/or potential risks surrounding the growth of the Sedibeng economy need to be noted. GD2 must address these growth constraints and look towards growing a better economy.
a | Labour constraints
These constraints are hindering the optimal performance of the economy, and put a strain on the labour market and job seekers, due to the fact that it is a difficult task to match the skills in the labour force to the number of available jobs in the job market.
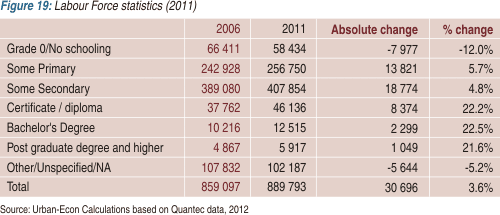
Figure 18 below highlights the highest level of education completed in 2006 and 2011 for the population in the Sedibeng District Municipality. The number of people that have Grade 0 or no schooling has declined from 2006 to 2011 with -12%, where the number of people that achieved some form of primary education has increased in this period by 13 821 people.
The biggest increases in education levels for Sedibeng was seen in the number of people achieving certificates or diplomas (22.2%), Bachelor's degrees (22.5%) and Post graduate degrees and higher (21.6%). This indicates that the levels of education are increasing and the population has become more skilled since 2006.
b | Over concentration in the metal manufacturing sector
Being the single biggest driver behind Sedibeng and the biggest export item of the municipality, the metal manufacturing sector is very sensitive to fluctuations in the global markets. The nature of its operations is highly dependent on global demand for steel and metal products, and when the global demand decreases, the sales of the Metal Manufacturing sector will also decrease and lead to a lesser contribution to Sedibeng's GVA. This was the case with the economic downturn in 2009, when the global markets retracted and caused the economic crisis.
c | Lack of diversification
The benefits surrounding a diversified economy are numerous, from creating job opportunities, to ensuring a more stable economy by spreading the risks in the case of exogenous impacts. By having a lack of diversification in the economy, the Sedibeng District Municipality, could potentially miss opportunities to tap into the Gauteng consumer market, thereby foregoing the opportunities of an extended consumer base (see section 5.1).
d | Image of the area give rise to a lack of Foreign Direct Investment (FDI)
Foreign Direct Investment (FDI) plays a significant and rising role in international business. For the economy that receives the investment, it can provide a source of capital, new technologies, processes, natural resources, products and management skills, and as such can provide a strong boost to economic development.
Foreign Direct Investment, in a very basic definition, is perceived as a company from one country making a physical investment into any form of capital generating goods and services in another country. The direct investment includes investment in structures, machinery and equipment, as well as the procurement of a continuous management interest in a company or economy in the foreign country.
In order to promote such investment, it is of vital importance that the foreign market that is looking to invest, be aware of the investment opportunities within a country or economy.
Sedibeng's marketing and branding should be of international standards and aimed at the international markets in order to attract these foreign investors.
Equally important is the physical environment of the municipality. Together, these two factors form the image of Sedibeng and will determine how it will be perceived by visitors and tourists. Sedibeng has released a Regional Spatial Development Framework 2011/12 and the Spatial Development Framework, discussing the rural development, local economic development, and flagship projects that are proposed to take place in the years to follow. All of these urban environment improvements, projects and initiatives will add to creating a positive and quality image of Sedibeng that will lure FDI.
e | Failure to implement key “Flagship” projects
In GDS 1 the following potential projects were prioritized within the region:

Of these projects mentioned above, very few of them have been implemented to the point where they are fully-functional. These projects hold enormous potential for long and short term employment, income, and tourism activities. By not ensuring these projects are progressing at a satisfactory rate, Sedibeng is losing out on the benefits it could have reaped, were these projects functioning already (see also section 4.4).
f | Addressing Growth Constraints
Although there seems to be a lot of issues and factors currently straining the economy, none of these constraints can in fact be categorised as structural problems, such as high unemployment and pervasive poverty. On the contrary, with very thorough and adequate economic planning and intervention in the Sedibeng District Municipality, these current growth constraints can be successfully addressed
4.6.10 The Policy Response to Economic Challenges
There has been a National and Provincial response to the challenges facing the South African and Gauteng economy. The challenges and responses are articulated in a variety of policy documents and pronouncements.
a | National Perspective
Articulation of the national perspective can be found in a plethora of policy documents including: The ANC manifesto; the State of the Nation Addresses of 2007-2011, NPC Report. IPAP2 stresses the structural imbalances in the current economic growth path of the country. It argues that we have slower growth than that of our peers in other countries, and that it is not the right type of growth as it is jobless growth. It points out that although manufacturing is the biggest production sector and that the automotive sector doubled from 1994 – 2008, insufficient jobs were created.
Whilst there has been strong growth in the natural resource based sectors (such as steel, aluminium, paper and pulp and cement), the rest of the manufacturing sector has stagnated. Employment has largely come from the service sector. The wholesale and retail sector has experienced growth, but this is what IPAP2 describes as the wrong type of growth. Wholesale and retail growth comes from private debt extension, contributing to a widening current account deficit. IPAP 2 stresses that longer term increases, in employment in all sectors of the economy, need to be underpinned by higher growth in production sectors, led by manufacturing. It adds that there is a problem of low productivity in the manufacturing sectors that has to be addressed.
The New Growth Path talks about decent work through meaningful economic transformation and inclusive growth. It argues that job creation is at the heart of economic success and that there needs to be a focus on youth employment. The New Growth path shines a spotlight on employment creation and seeks to achieve 5 million new jobs by 2020. It identifies where employment creation is possible. It then analyses the policies and institutional developments required to take advantage of these opportunities.
b | Gauteng Perspective
In terms of challenges and priorities, the Gauteng perspective, in many ways mirrors the national perspective. It finds expression in many key documents including; The State of the Province Address, the Premier's Programme of Action, the draft 2055 strategy; the Medium Term Strategic Framework and the Gauteng Employment, Growth and Development Strategy (GEGDS), the Draft Gauteng Industrial Policy; the draft Infrastructure Investment Plan and other documents. The MTSF provides a medium term articulation of the 2055 vision and strategy. The MTSF has 7 strategic priorities, which are one of which is, 'creating decent work and building a growing, inclusive economy'.
The GEGDS is a sub-set of the Gauteng Medium Term Strategic Framework, 2009 – 2014, and focuses entirely on 'creating decent work and building a growing, inclusive economy'. GEGDS asks the question:
“What would it take to create an economy that is inclusive and brings benefit to all citizens, that is sustainable and not exploitative, that innovates rather than stagnates?”
The GEGDS has 5 pillars which help to articulate its goals. These are:
- Transforming the provincial economy through improved efficiencies
- Sustainable employment creation
- Increasing economic equity and ownership
- Investing in people
- Creating sustainable communities and building social cohesion
4.7
The Environment
Sedibeng has serious environmental challenges. It is the source of major smokestack driven by heavy industrial air pollution (steel and chemical industrial activity) as well as coal and wood smoke from the townships. Midvaal and Emfuleni municipalities are particularly negatively affected. Sedibeng also suffers from serious water pollution problems in river systems and water bodies, notably the Klipriver and Blesbokspruit which are polluted from runoff from industrial areas, townships and waste water treatment works. In addition the Vaal River suffers from raw sewerage spillages due to the aging infrastructure in Emfuleni.
While ground water quality is monitored in Emfuleni, Lesedi and Midvaal have not conducted any monitoring to establish the pollution levels of groundwater. Of similar concern is the fact that Midvaal and Lesedi do not have any pollution contingency measures in place to prevent surface water pollution. Despite the above, the region has magnificent environmental assets such as Suikerbosrand, the Vaal River, Vaal Dam and pockets of high potential agricultural land.
Agriculture takes up approximately 33% of the total land use in Sedibeng.The challenges that Sedibeng faces in promoting agricultural growth are similar to elsewhere in South Africa, namely:
Land use and ownership patterns are skewed,
High levels of soil-degradation, erosion and bush encroachment exist,
Agricultural initiatives are ad hoc and do not enjoy strategic, institutional or technical support and
There is a general lack of awareness to promote agriculture amongst poorer communities as a means to ensure a sustainable food and income source
4.8
Sedibeng - Socio-Economic Analysis (Provincial Context)
It is important to contextualise an analysis of the Sedibeng District in relation to the Gauteng Provincial profile. Provincial contextualisation leads to significant analysis of developmental plans as well as economic and investment opportunities. If one takes the example of road construction by the Gauteng Province in 2012, a visual snapshot emerges about mobility, construction expenditure, developmental corridors , speed of connectivity which affects delivery and access time to goods and services. In 2012, GPG will spend over R500 million on the construction and maintenance of roads in the province. These include the N14 (linking the north of the province with the west), R25 (which connects Johannesburg with Groblersdal via Kempton Park and Bronkhorstspruit), R82 (the old Vereeniging road).
4.8.1 Demographics
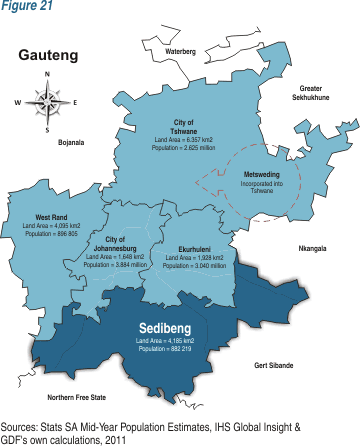
The districts has 7.8 percent of the province's population and a land size of 4,185 km2.
4.8.2 Economic Performance
Economic Contributions by Municipalities
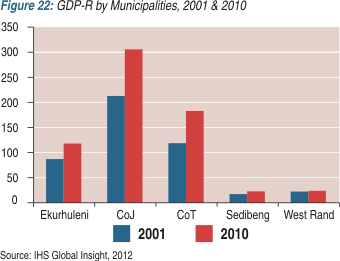
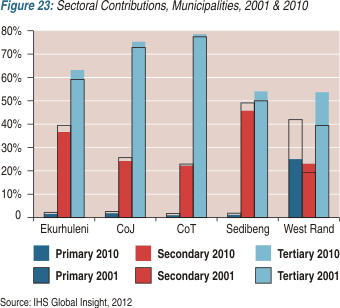
In Sedibeng, the secondary sector's contribution was almost as large as that of the tertiary sector in 2001, with less than a percentage point between them, but the difference had increased to 8 percentage points by 2010. The district's manufacturing sub-sector lost a portion of its share of GDP-R by 2010, while the construction subsector grew but from a low base. The district's finance & business services, by contrast, experienced comparatively brisk growth. Its larger base, however, resulted in manufacturing remaining the largest sub-sector in Sedibeng in 2010.
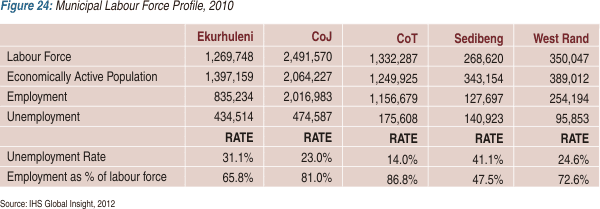
Sedibeng had the smallest share at about 268,000. Sedibeng had the smallest share of employment at 128,000 and the West Rand the second smallest at 254,000. Sedibeng had the highest unemployment rate, at 41.1 percent, followed by Ekurhuleni at 31.1 percent and the West Rand at about 24.6 percent. The weak manufacturing sub-sector in Sedibeng and the shedding of jobs by larger companies in the district has affected employment levels.

Reasons for the high unemployment rate in Sedibeng may include the shedding of jobs by the Arcelor Mittal steel company which is situated in the district.
4.8.4 Access to Services The Sedibeng Regional Sanitation Scheme, mentioned in the SoPA, will expand the capacity of two treatment plants in the district. Approximately 88 percent of households in the province had access to formal refuse removal in 2010, with the national percentage significantly lower at 61.4 percent. The CoJ had the highest proportion of households with weekly local authority refuse removal. The Sedibeng district had the highest proportion of households with no refuse removal.
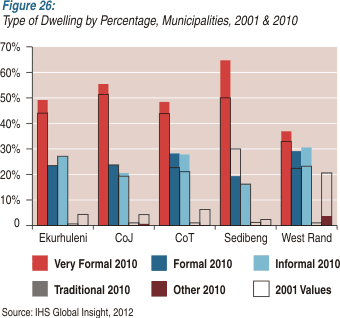
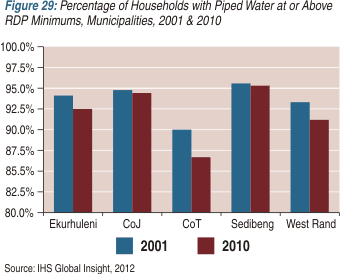
The proportion of Sedibeng's households living in very formal dwellings has risen sharply to 64.2 percent, a 14.5 percentage point increase from 49.7 percent in 2001. This makes it the Gauteng municipality with the highest share in this category. Most of this increase is accounted for by the district's reduction in the percentage of households living in formal dwellings; at 19.9 percent in 2010, Sedibeng had the smallest share in this category. While the district recorded small decreases in all of the other three categories, it would appear that many of its new very formal dwellers are former formal dwellers who received a plumbing upgrade. In Sedibeng, and all of Gauteng's other municipalities, there was a reduction in the share of households with access to piped water at or above Reconstruction and Development Programme (RDP) minimums. Sedibeng also had the province's largest reduction in the percentage of households living in informal settlements, from 16.4 percent in 2001 to 15.6 percent in 2010.
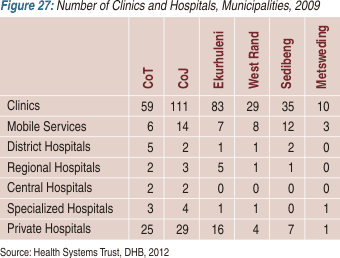
Amongst the districts, Sedibeng had the highest number of health facilities in most categories, including seven private hospitals; this was followed by West Rand and then Metsweding, with four and one private hospitals respectively.
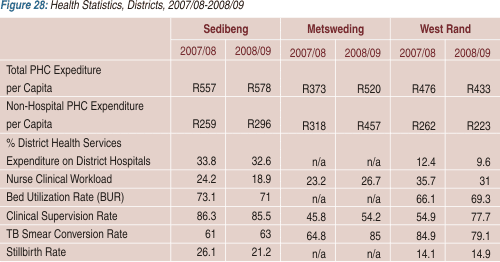
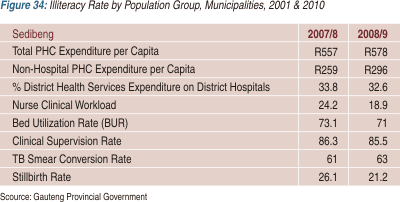
Between 2008/09 and 2007/08, total PHC expenditure per capita and non-hospital PHC expenditure per capita increased in both Sedibeng and Metsweding. Total PHC expenditure per capita in Sedibeng increased slightly from R557 to R578 in 2008/09.
In Sedibeng, non-hospital PHC expenditure per capita increased to R296 in 2008/09 from R259 in 2007/08. At 18.9 patients in 2008/09, Sedibeng had lower nurse clinical workload levels than Metsweding and the West Rand.
Comparison of the BUR is made only between the West Rand and Sedibeng as Metsweding has no district or central hospital. Among Gauteng's districts, the BUR was highest in Sedibeng, at 71 percent in 2008/09, although this was a slight decrease of 2.1 percentage points compared with the 73.1 percent of 2007/08. The clinic supervision rate was also higher in Sedibeng, at 85.5 percent in 2008/09, although this was a decrease of 0.8 percentage points compared with 2007/08 at 86.3 percent. Stillbirth rates were higher in Sedibeng, at 21.2 per 1,000 in 2008/09, compared with 14.9 in the West Rand in the same financial year.
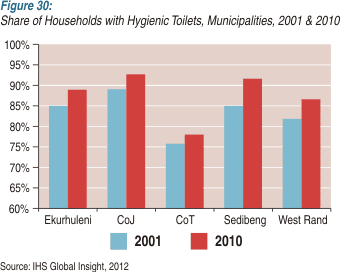
The largest increase was in Sedibeng, with its proportion rising by 6.3 percentage points from 85.4 percent in 2001 to 91.7 percent in 2010.
There are eight waste treatment plants among Sedibeng's three local municipalities; they had an average Green Drop score of 62.5 percent and none received Green Drop certification. The Premier, mentioned in her SoPA that the Sedibeng Regional Sanitation Scheme includes maintenance and repairs of four of the district's treatment plants to date and will concentrate on the expansion of the capacity of two of these plants.
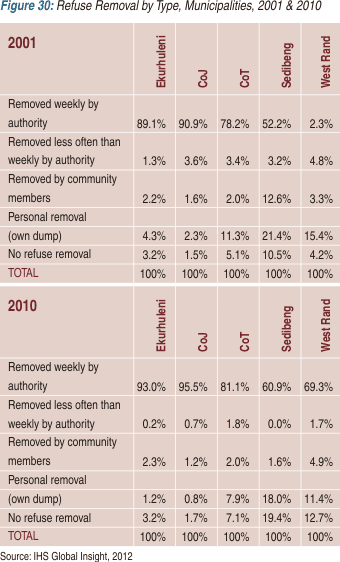
Sedibeng had the lowest share, although it improved significantly from 52.2 percent in 2001 to 60.9 percent in 2010, an 8.7 percentage point increase. It was also the district with the highest proportion of households with no refuse removal (19.4 percent) and personal removal (18 percent) in 2010.
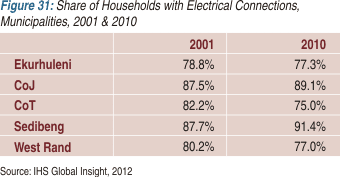
n 2001, Sedibeng had the highest share of households with electrical connections, at 87.7 percent. In 2010, Sedibeng remained the highest in terms of households with electrical connections, at 91.4 percent.
4.8.5 Development Indicators
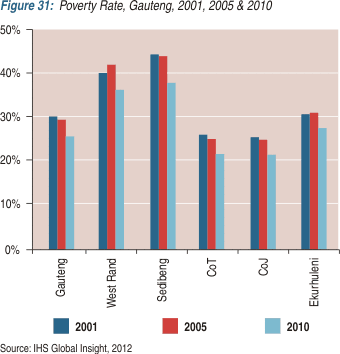
The high poverty rate in Sedibeng could be explained by the fact that it is more rural in nature than the other municipalities. The poverty rate declined from 44 percent in 2001 to 38 percent in 2010. At 36 percent, the West Rand's 2010 poverty rate was slightly lower than that of Sedibeng for the same year. The province's poverty rate decreased from 30 percent in 2001 to 29 percent in 2005 and to 26 percent in 2010. Sedibeng had the highest poverty rate over the reviewed period, although this also has been declining.
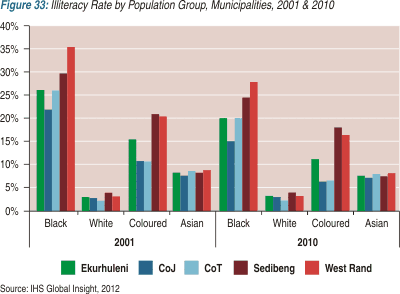
The White population group in all municipalities had the lowest illiteracy rate in 2001 and 2010, at 3 percent for both years.
4.9
Conclusion
The analysis section provides a picture of a region that in spite of progress in some areas, and in spite of a wealth of opportunities, faces the daunting task of improving the quality of lives of the people of Sedibeng, through providing both an enabling environment for growth and prosperity, and directly intervening to bring that development and fortune to the Region as soon as possible. The next section sets out the vision to do this.
|